Posted Tuesday April 15, 2025
An audiogram is basically a chart that shows the results of your hearing test. It tells us how loud a sound has to be for you to hear it about half the time. If your hearing falls outside the typical range, it might mean you have some hearing loss.
What tests are mapped on an audiogram?
There are two main types of tests that get plotted on an audiogram:
-
Pure tone air conduction test
This test checks your hearing threshold—basically, how soft a sound can be before you stop hearing it. You’ll wear headphones or earphones and listen to beeps at different pitches (or frequencies). The results show the quietest sounds you can hear at each pitch. -
Pure tone bone conduction test
This one helps figure out what type of hearing loss you might have. A small device is placed behind your ear that sends gentle vibrations directly to your inner ear through your skull. This skips the outer and middle ear, so we can tell if the problem is in the inner ear (sensorineural hearing loss), middle/outer ear (conductive hearing loss), or both (mixed hearing loss).
What those symbols mean
Here’s how to make sense of the little marks on your audiogram:
-
O = Right ear (air conduction)
-
X = Left ear (air conduction)
-
< or [ = Right ear (bone conduction)
-
> or ] = Left ear (bone conduction)
These symbols show the quietest sounds each ear can hear at different pitches.
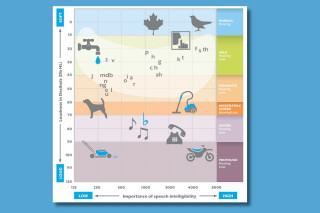
You might also see some random letters like “sh,” “ch,” “e,” or “i” plotted on the graph. These aren’t test results—they're part of what's called the “speech banana”. It’s a visual guide that shows where common speech sounds fall in terms of pitch and loudness. It's super helpful to see which speech sounds might be harder to catch if you have hearing loss.

How to read an audiogram without feeling lost
Think of the audiogram like a map for your hearing.
-
The horizontal axis is all about pitch, or frequency, and is measured in Hertz (Hz). It goes from low sounds (like thunder or a bass drum at 125 Hz) to high sounds (like birds chirping or a whistle at 8000 Hz).
-
The vertical axis measures loudness, in decibels (dB HL). It ranges from very soft sounds (-10 dB HL, which is not silence!) to extremely loud ones (like sirens or chainsaws at 110 dB HL).
What do my results mean?
Normal hearing vs. hearing Loss
If your hearing threshold is up to 20 dB, that’s considered normal. If you need a sound to be 25 dB or louder to hear it, that could indicate hearing loss.
Let’s say your audiogram shows:
-
Good hearing (under 20 dB) from 250 to 1000 Hz
-
But worse hearing (above 25 dB) for higher frequencies above 2000 Hz
That would suggest a high-frequency hearing loss, possibly in both ears.
Using the speech banana, your hearing specialist can point out which speech sounds you’re likely missing—like “s,” “f,” or “th,” which often land in the high-frequency range.
What kind of hearing loss is it?
-
Conductive hearing loss: If your bone conduction results are way better (by more than 10 dB) than your air conduction results—and bone conduction falls in the normal range—it’s likely a conductive issue. This usually means something’s going on in the middle or outer ear, and it can often be fixed with medication or surgery.
-
Sensorineural hearing loss: If your bone and air conduction results are close together (within 10 dB), and both show reduced hearing, it points to sensorineural loss. This usually involves the inner ear and is usually permanent, but hearing aids can help a lot.
-
Mixed hearing loss: You guessed it—it’s a combo of both.
In a sample audiogram below, the air and bone conduction results match and both show hearing loss, it’s a clear case of sensorineural hearing loss.
Again, this is where the speech banana helps visualise what someone might be missing in everyday conversation.

Questions? Ask us
Remember that your hearing care professional is the best resource for explaining your individual audiogram results. We are always happy to answer any questions you may have.